
AI Agent to Turn Multiple Google Sheets into a Live Dashboard
API Spreadsheets Team ·

Overview
Want to merge two Google Sheets with different structures into a single live dashboard—no manual exports or copy/paste? This guide walks you through creating an AI Agent (Python + API Spreadsheets) that understands both Sheets, aligns their data, and renders a synced HTML visualization that updates as your Sheets change.
What you’ll build
- Connect two Google Sheets (Sales + Expenses) to API Spreadsheets.
- Build and run an Agent that aligns/merges their data.
- Open a live HTML dashboard driven by spreadsheet API URLs.
Prerequisites
- Two Google Sheets in the same Google account.
- API Spreadsheets account with active
access_key/secret_key. - Python environment with
apispreadsheetsinstalled.
Where to find your keys
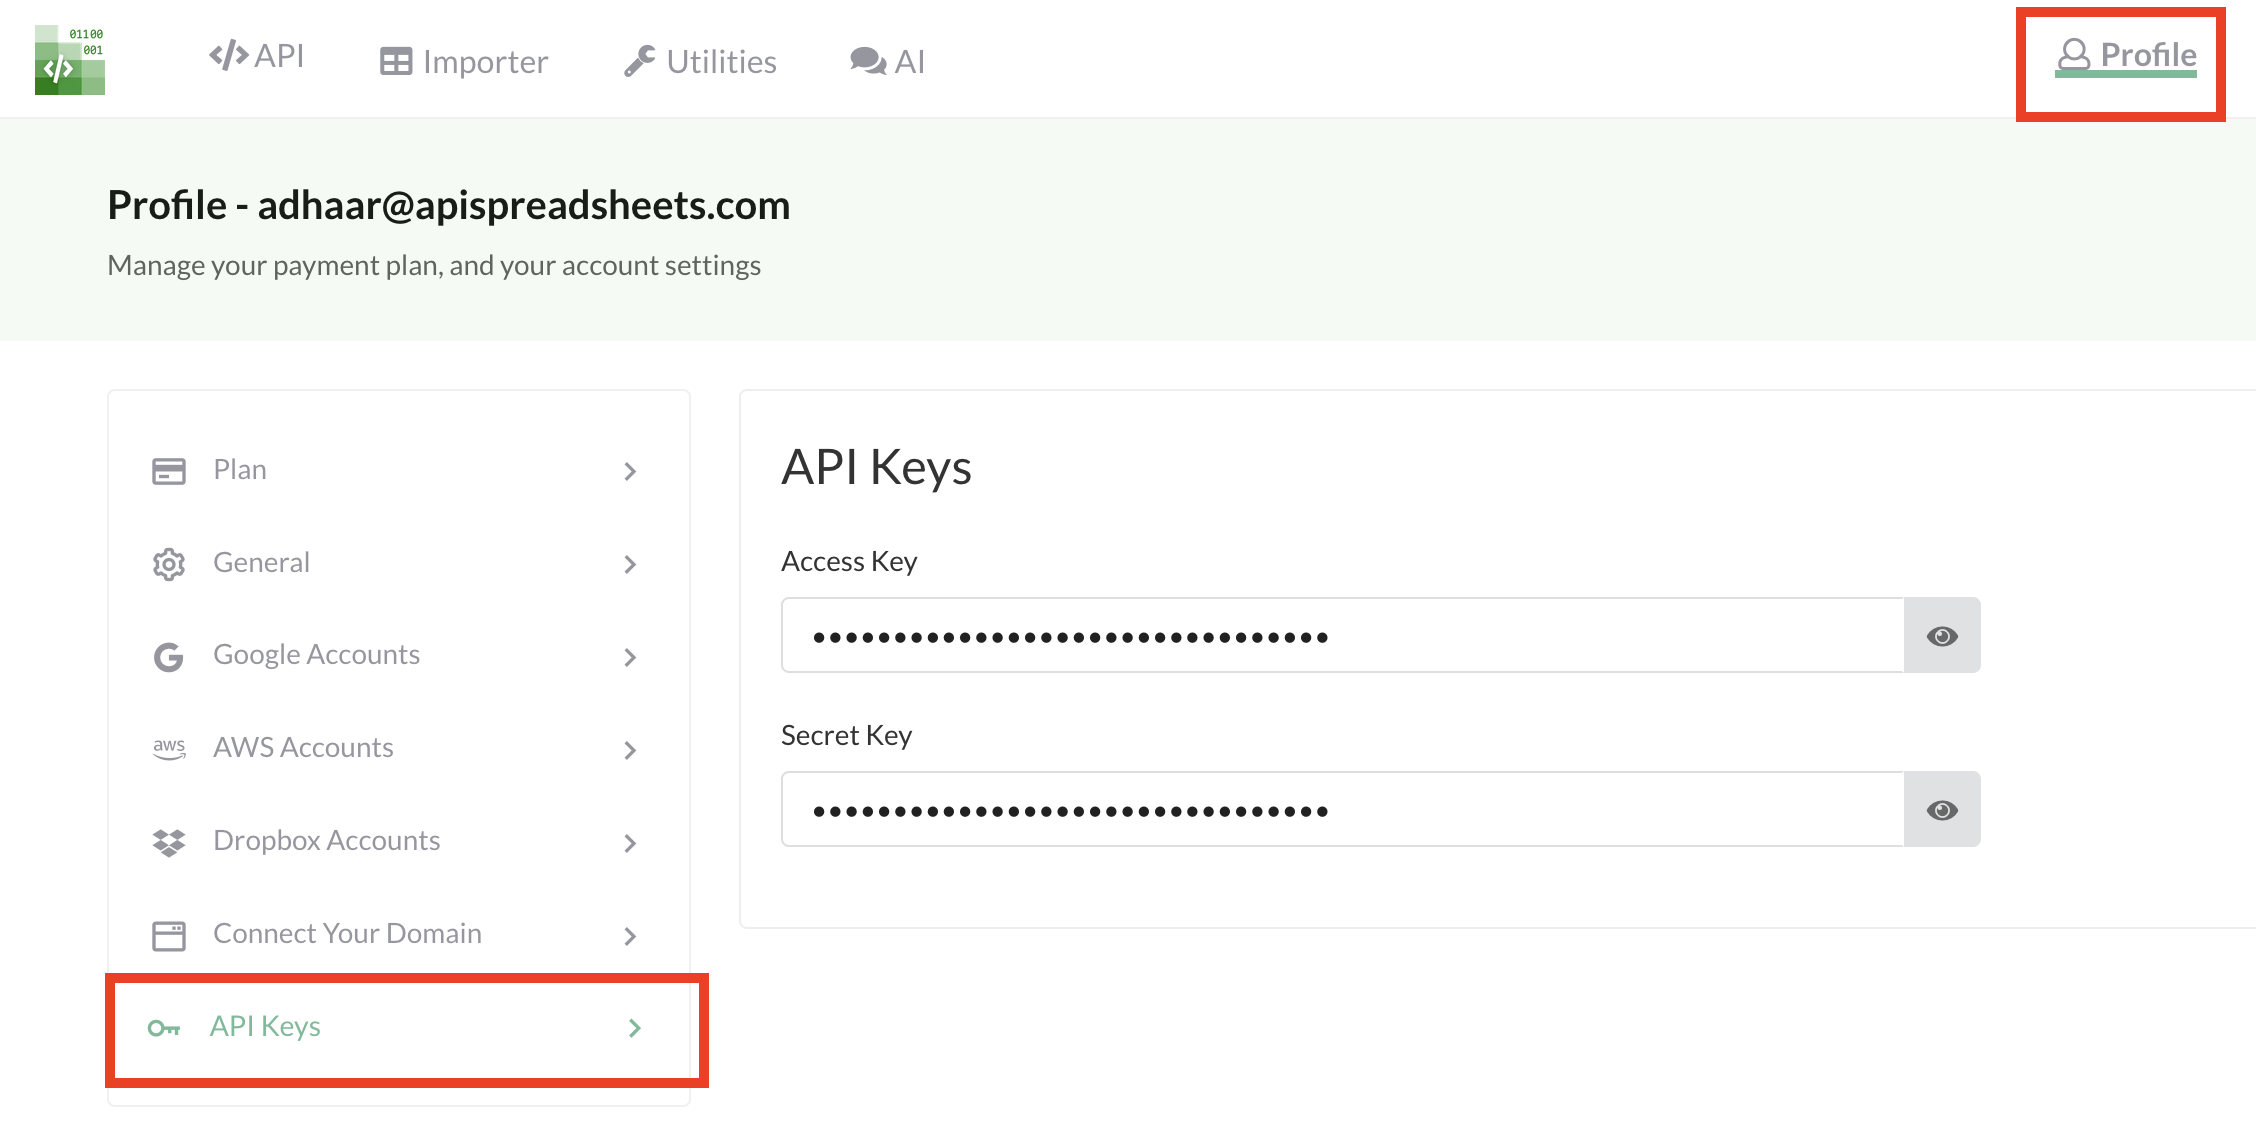
Connect your Sheets
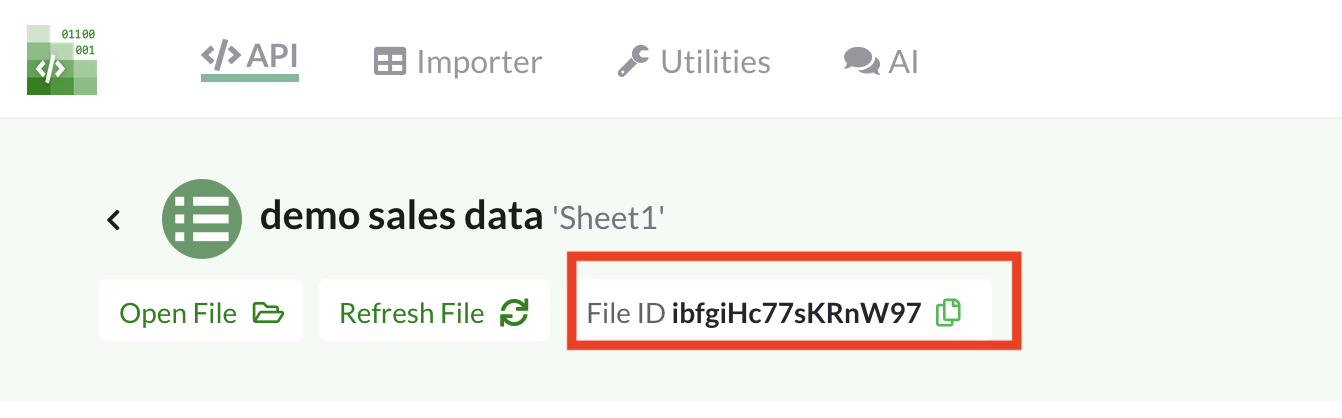
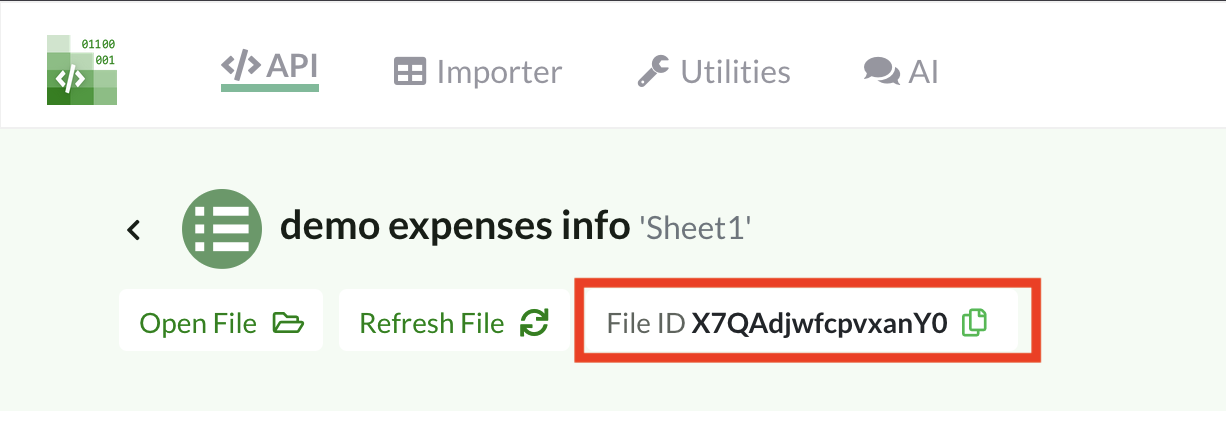
Upload both Sheets to your API Spreadsheets account, then copy each File ID from the file pages.
Install the client
pip install apispreadsheetsBuild the Agent (step-by-step)
1) Initialize the client with your keys
import os, time
from apispreadsheets import APISpreadsheets

account_access_key = os.getenv("ACCOUNT_ACCESS_KEY")
account_secret_key = os.getenv("ACCOUNT_SECRET_KEY")
if not (account_access_key and account_secret_key):
    raise SystemExit("Set ACCOUNT_ACCESS_KEY and ACCOUNT_SECRET_KEY")

client = APISpreadsheets(access_key=account_access_key, secret_key=account_secret_key)
2) Provide your two file IDs (Sales + Expenses)
file_ids = ["X7QAdjwfcpvxanY0", "ibfgiHc77sKRnW97"] # ← replace with your IDs3) Build the Agent that generates a live HTML dashboard
build = client.build_agent(
  agentName="Sales & Expenses Visualization Agent",
  agentDescription="Visualizes sales & expenses from two spreadsheets.",
  selectedFiles=file_ids,
  fileDescriptions={
    file_ids[0]: "Expenses related to various sales regions",
    file_ids[1]: "Sales revenue of various regions",
  },
  selectedOutputFormats=[".html"],
  agentInstructions=(
    "Merge both files and make a live visualization of all the information in the files. "
    "Create appropriate charts and filters in the visualization. "
    "Use sensible headers to merge and analyze the data."
  )
)
agent_hash = build["agent_hash"]
agent_ak = build["access_key"]
agent_sk = build["secret_key"]
4) Run the Agent
run = client.run_agent(
  agent_hash=agent_hash,
  temperature=0.1, top_p=0.9,
  access_key=agent_ak, secret_key=agent_sk
)
job_id = run["job_id"]
5) Poll for completion and grab the download URL
while True:
  status = client.agent_job_status(job_hash=job_id, access_key=agent_ak, secret_key=agent_sk)
  if status["status"] == "completed":
    # status["output"]["download_url"] contains presigned links to outputs (time-limited)
    print("Completed:", status)
    break
  if status["status"] in ("running", "starting"):
    print("Waiting…"); time.sleep(5)
  else:
    print("Failed:", status); break
Full code: use the “Download Full Python Code” button at the top of this page (from guidesData → downloads.python.files).
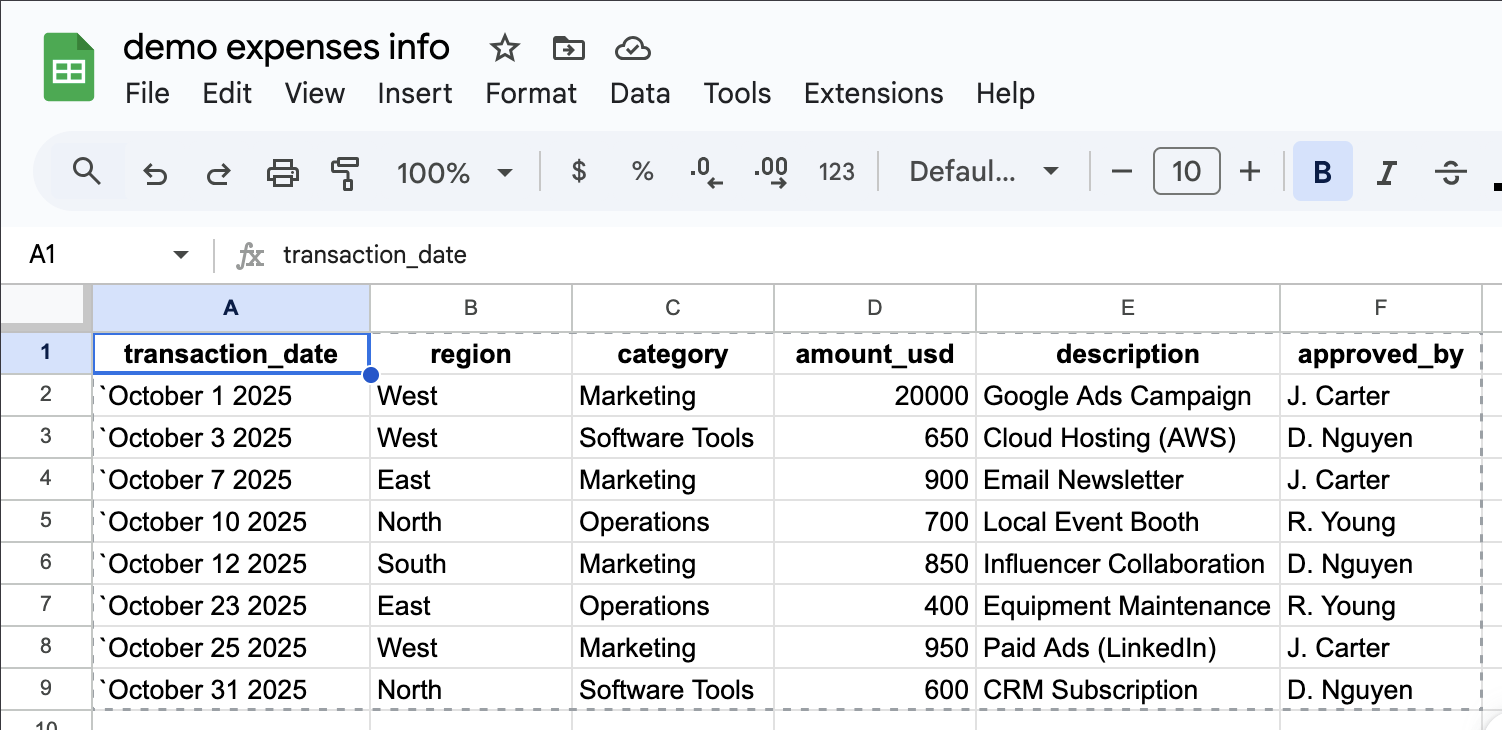
Source data (Sales & Expenses)
Here are the example Sheets we’ll use for the live dashboard:


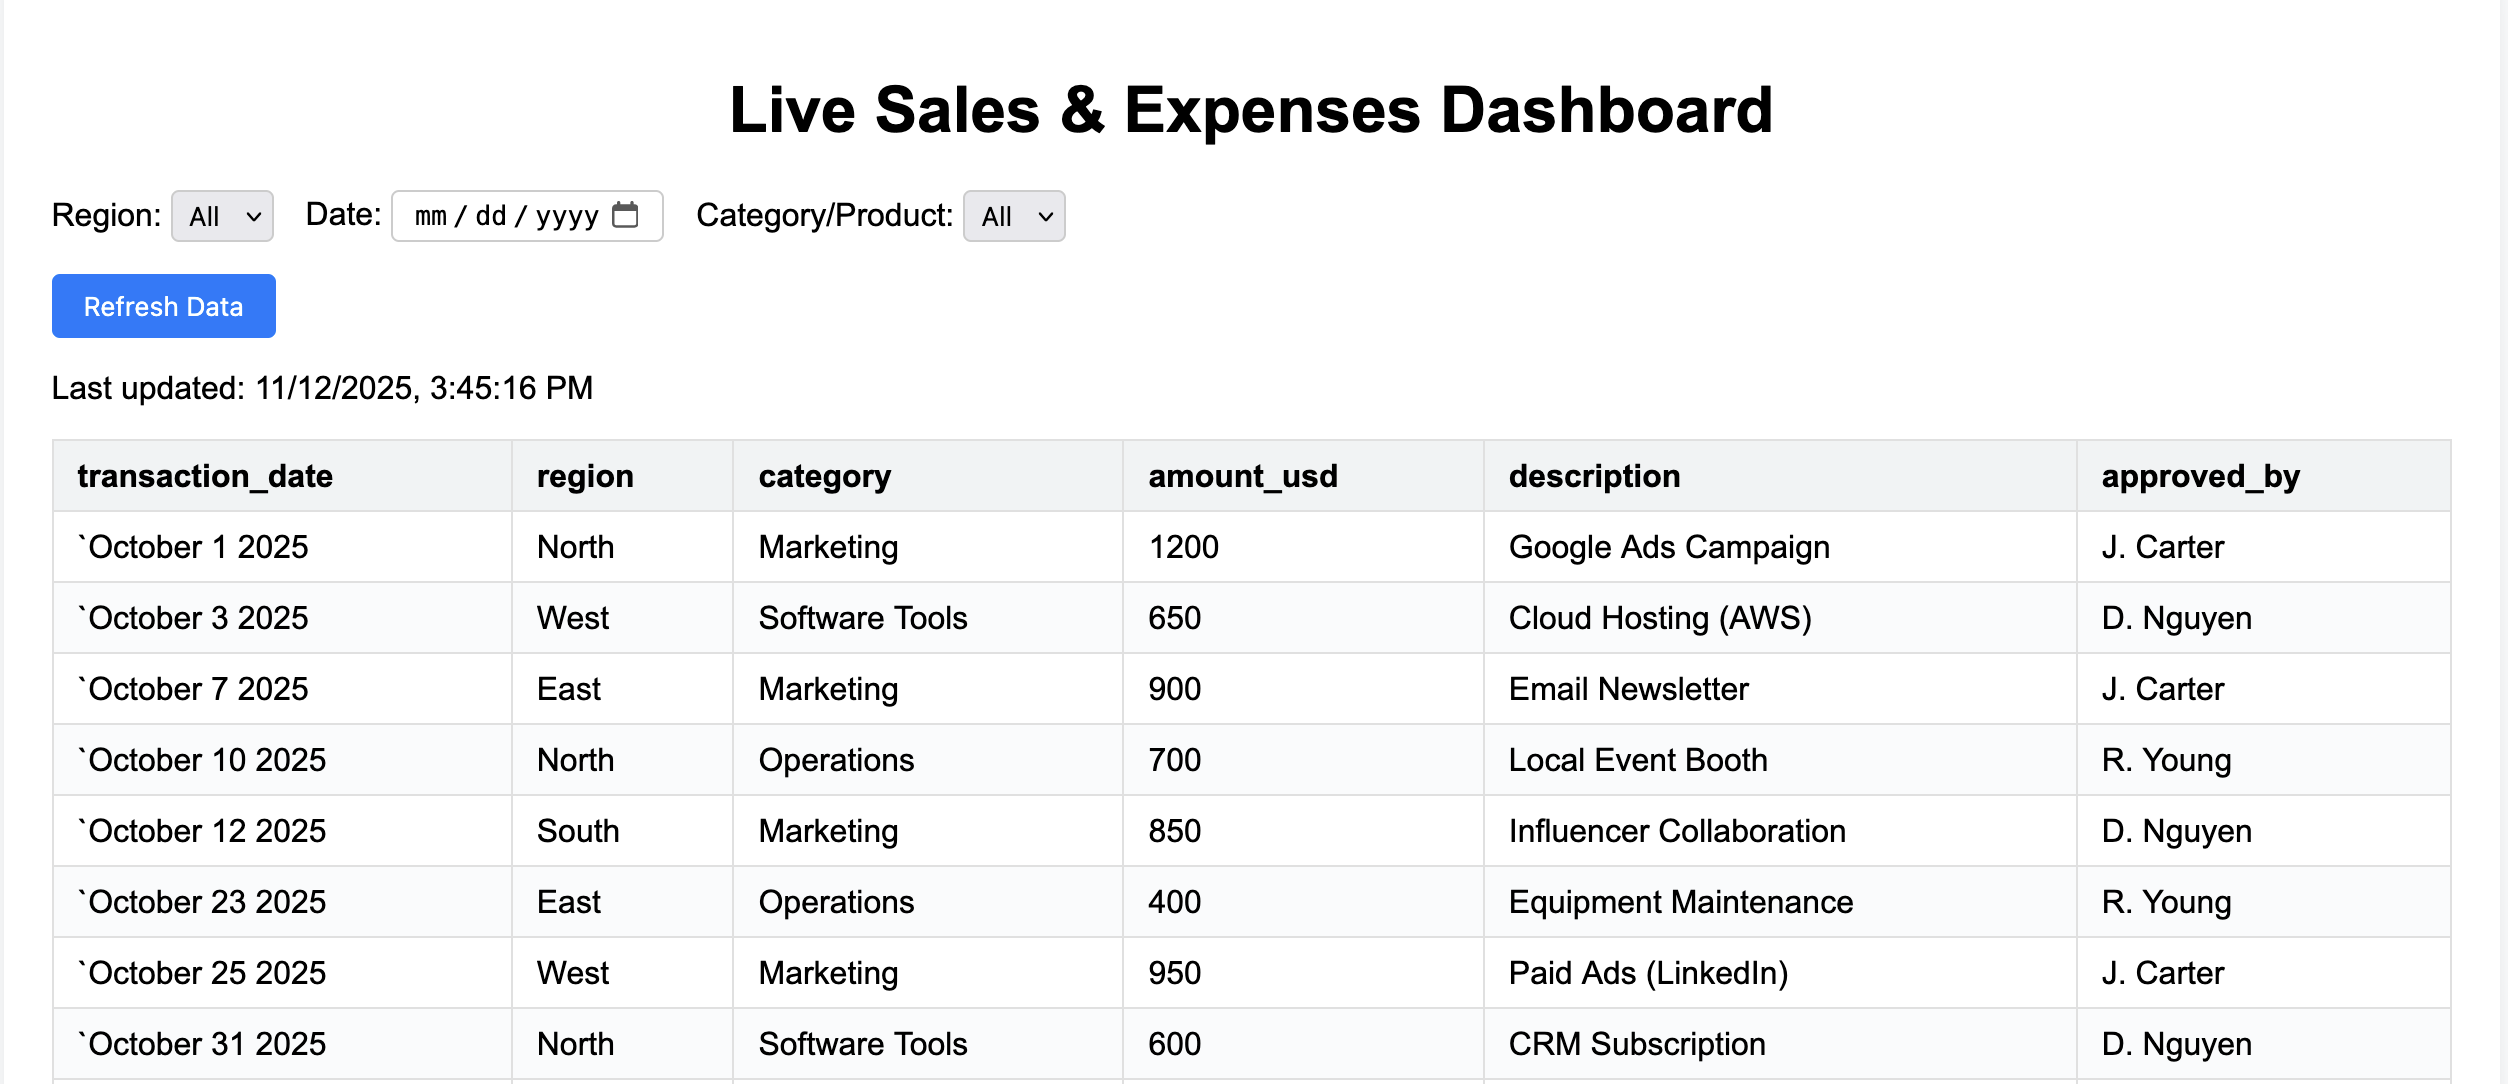
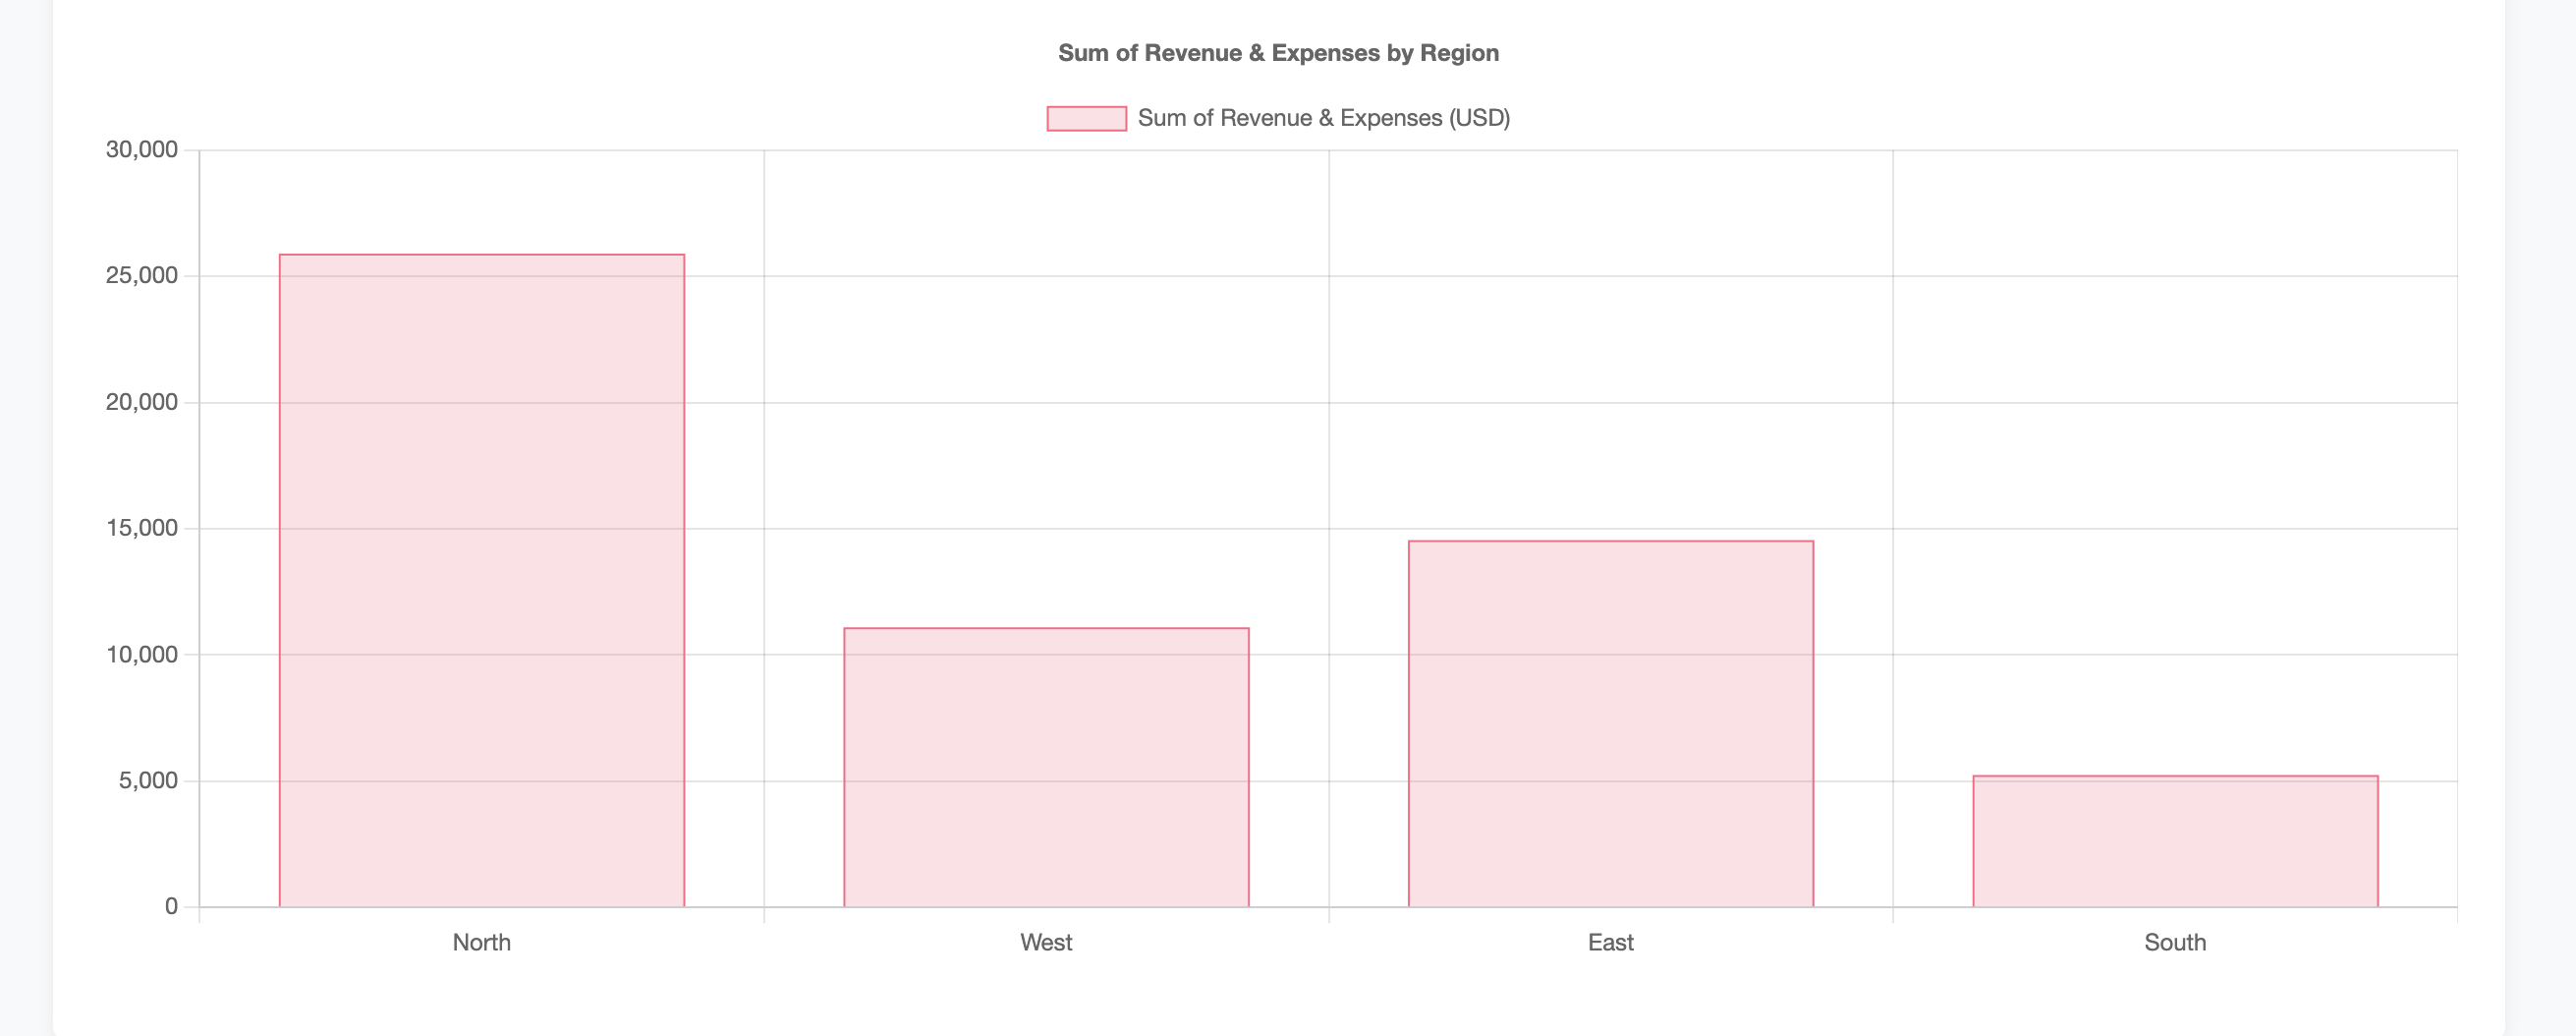
Live dashboard output (initial)
After the Agent finishes, open the .html output from the presigned link (remember: links are time-limited). The dashboard loads data from live spreadsheet API URLs.
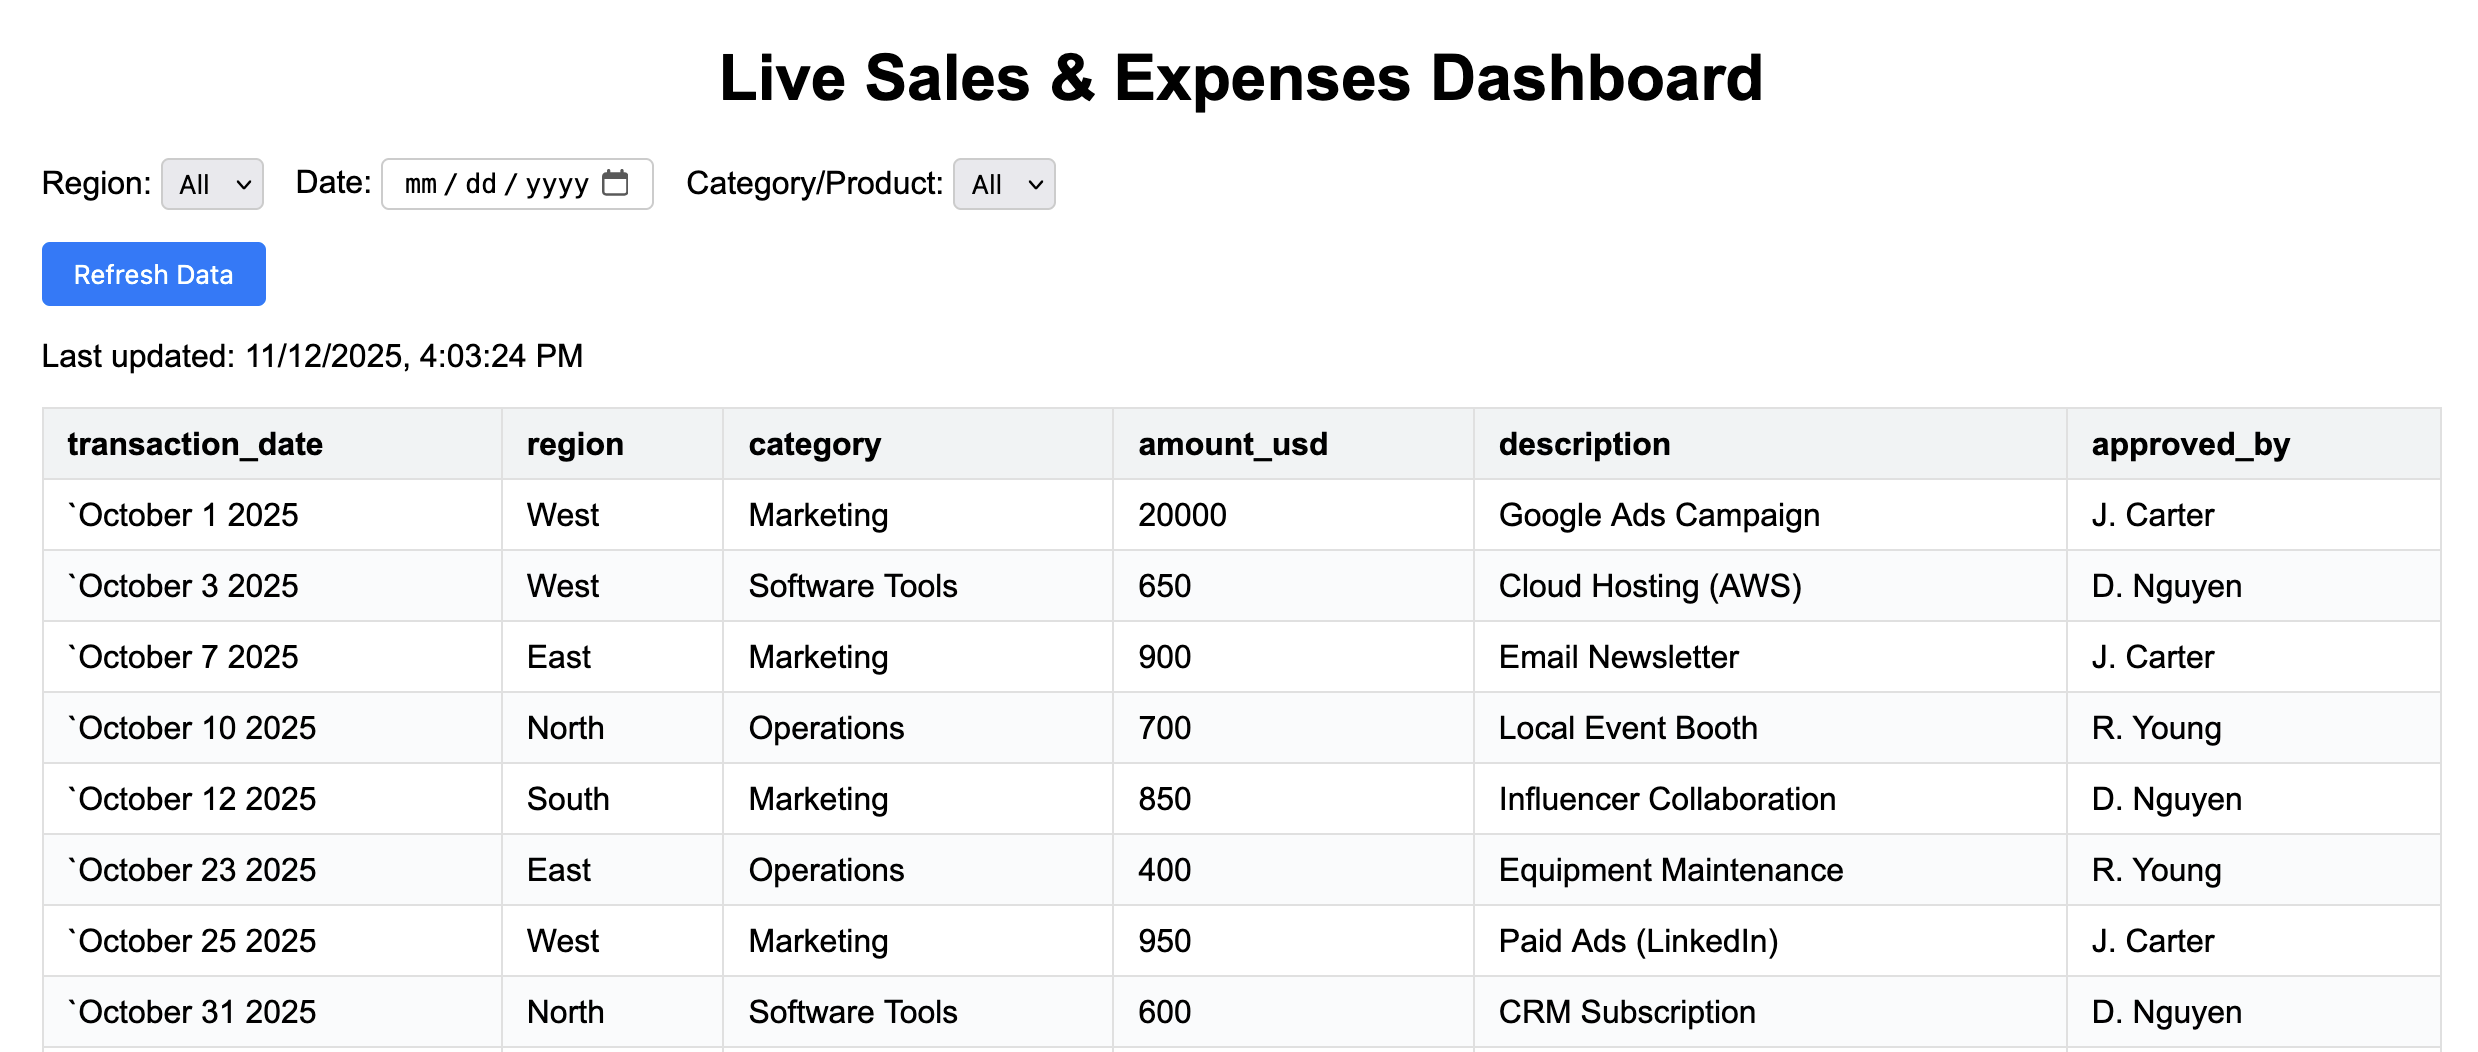
Change a Sheet → Dashboard updates
Update a value in your connected Google Sheet, then refresh the HTML dashboard. Because it pulls from live spreadsheet API URLs, your visuals reflect the new data immediately.

Tips
- Name files and columns clearly—your
fileDescriptionshelp the Agent align schemas. - Prefer smaller, focused Sheets for faster runs.
- For deterministic updates, re-run with stable instructions.